Skip to Content Back to home Skip to Navigation

Cutting bills and creating jobs

The economic opportunities of a clean energy transition

Science makes clear that to stabilize the climate, we must rapidly phase out fossil fuels and replace them with a clean energy system. Governments hold the key to making this happen. What often holds them back is uncertainty about what this means for the people and the economy of their country.

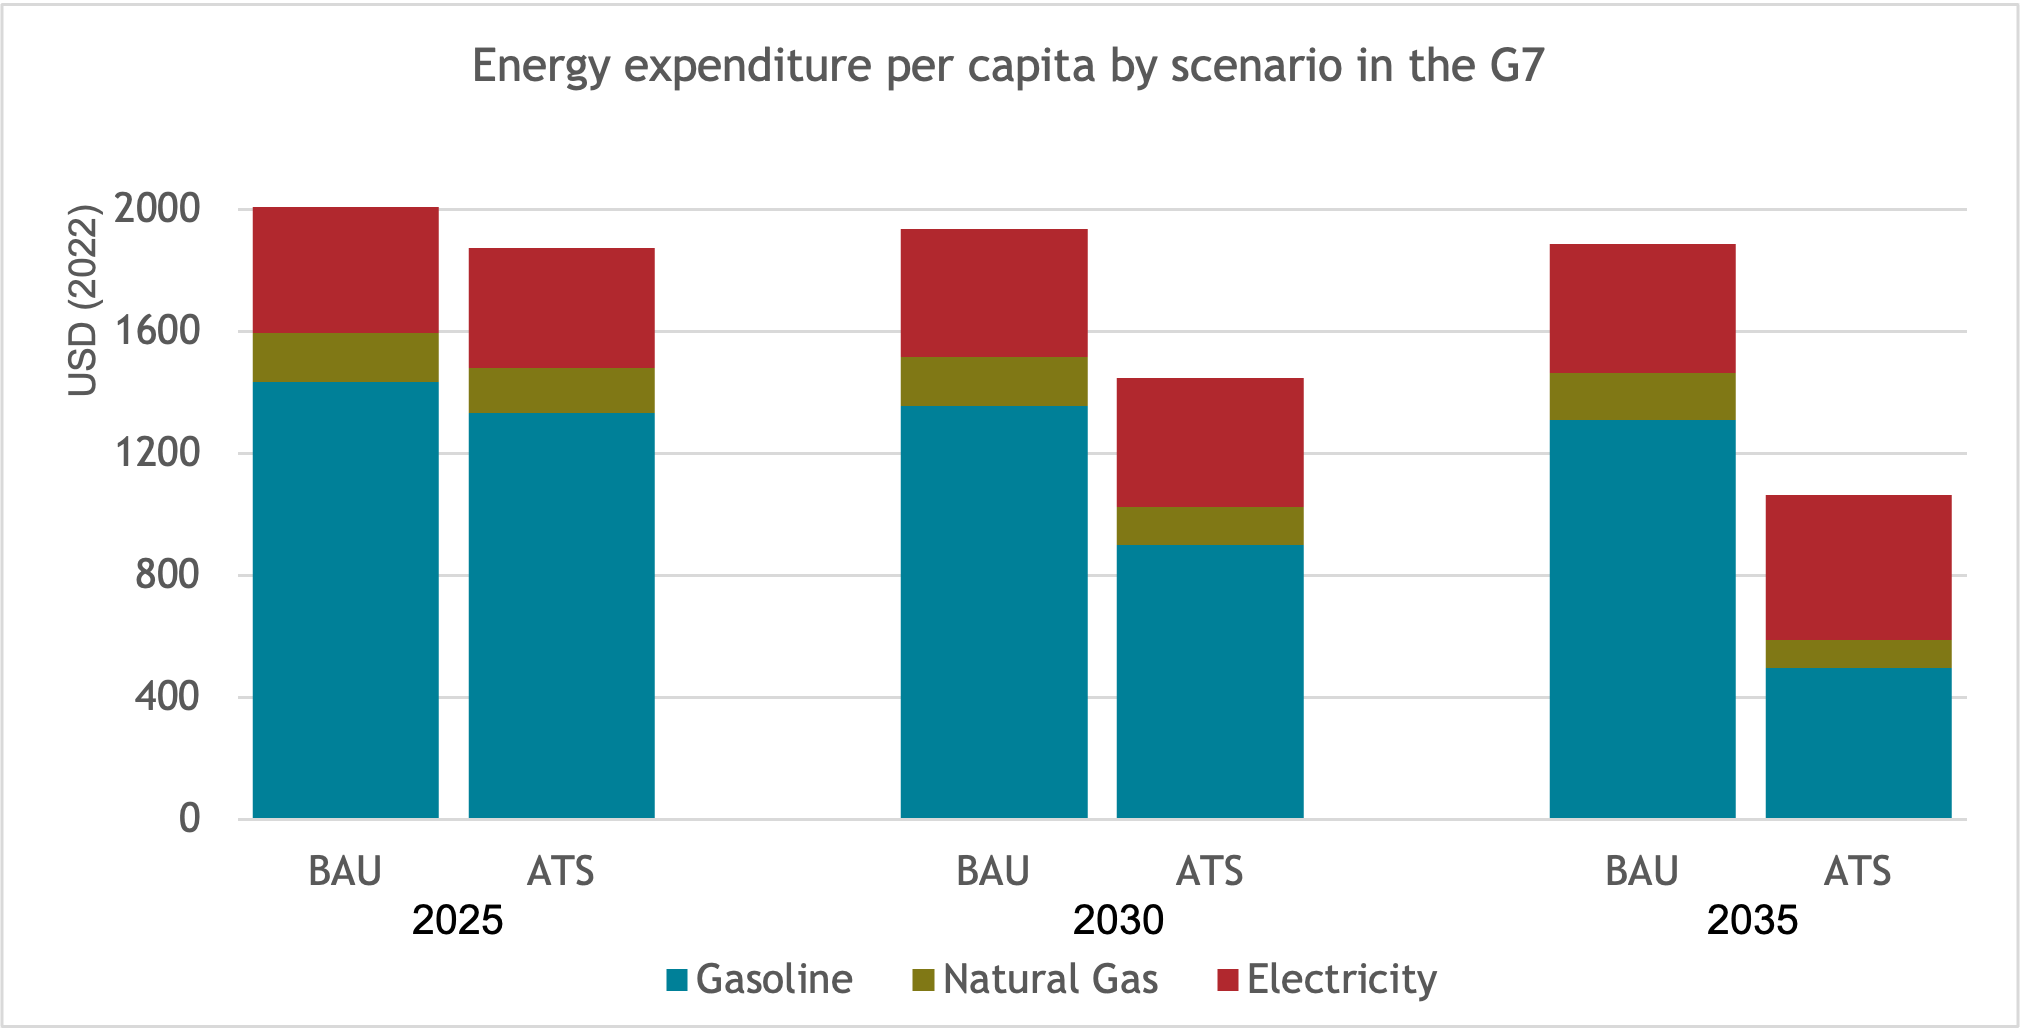
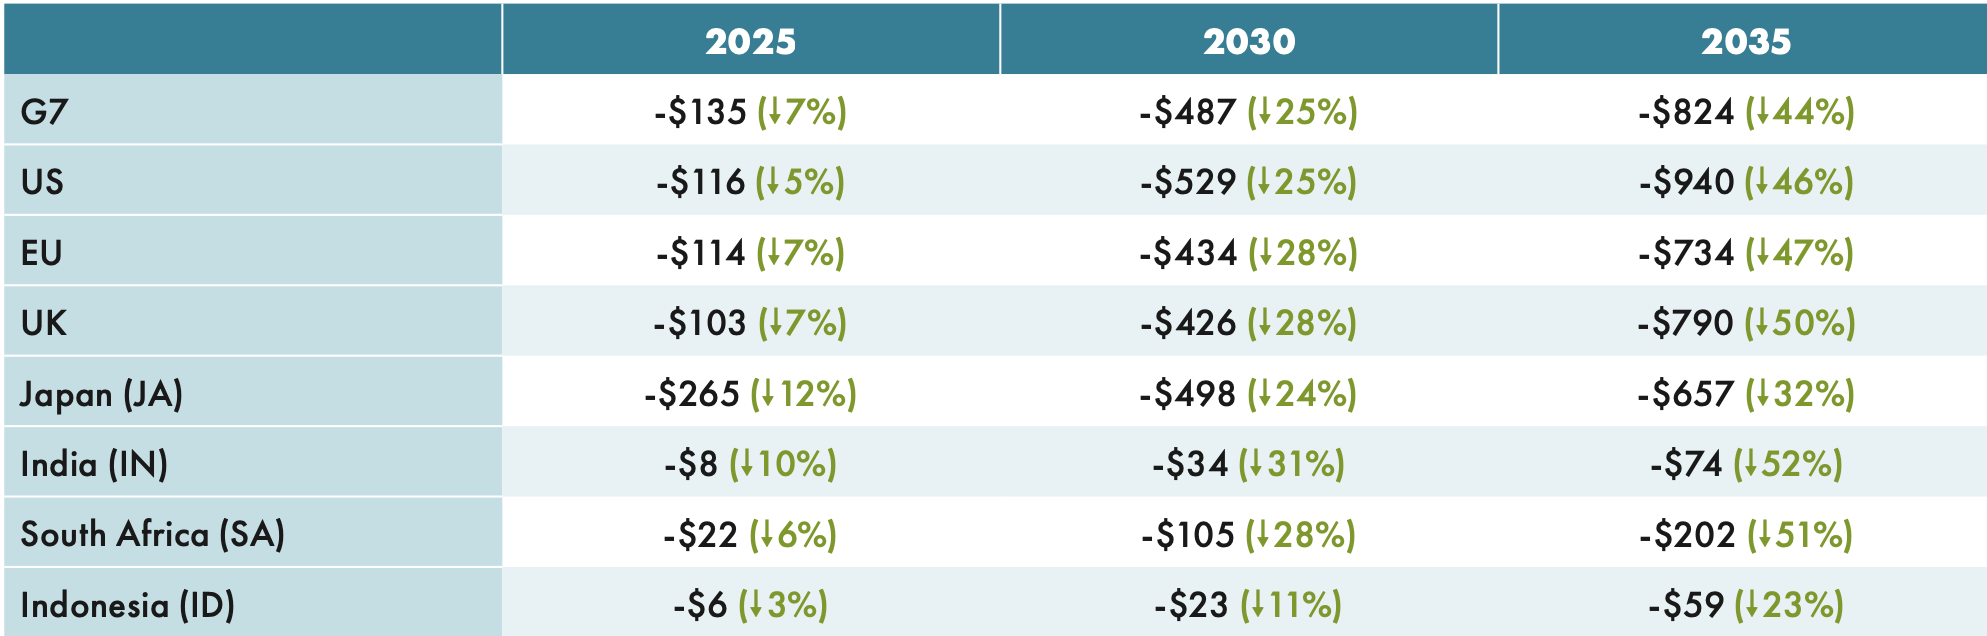
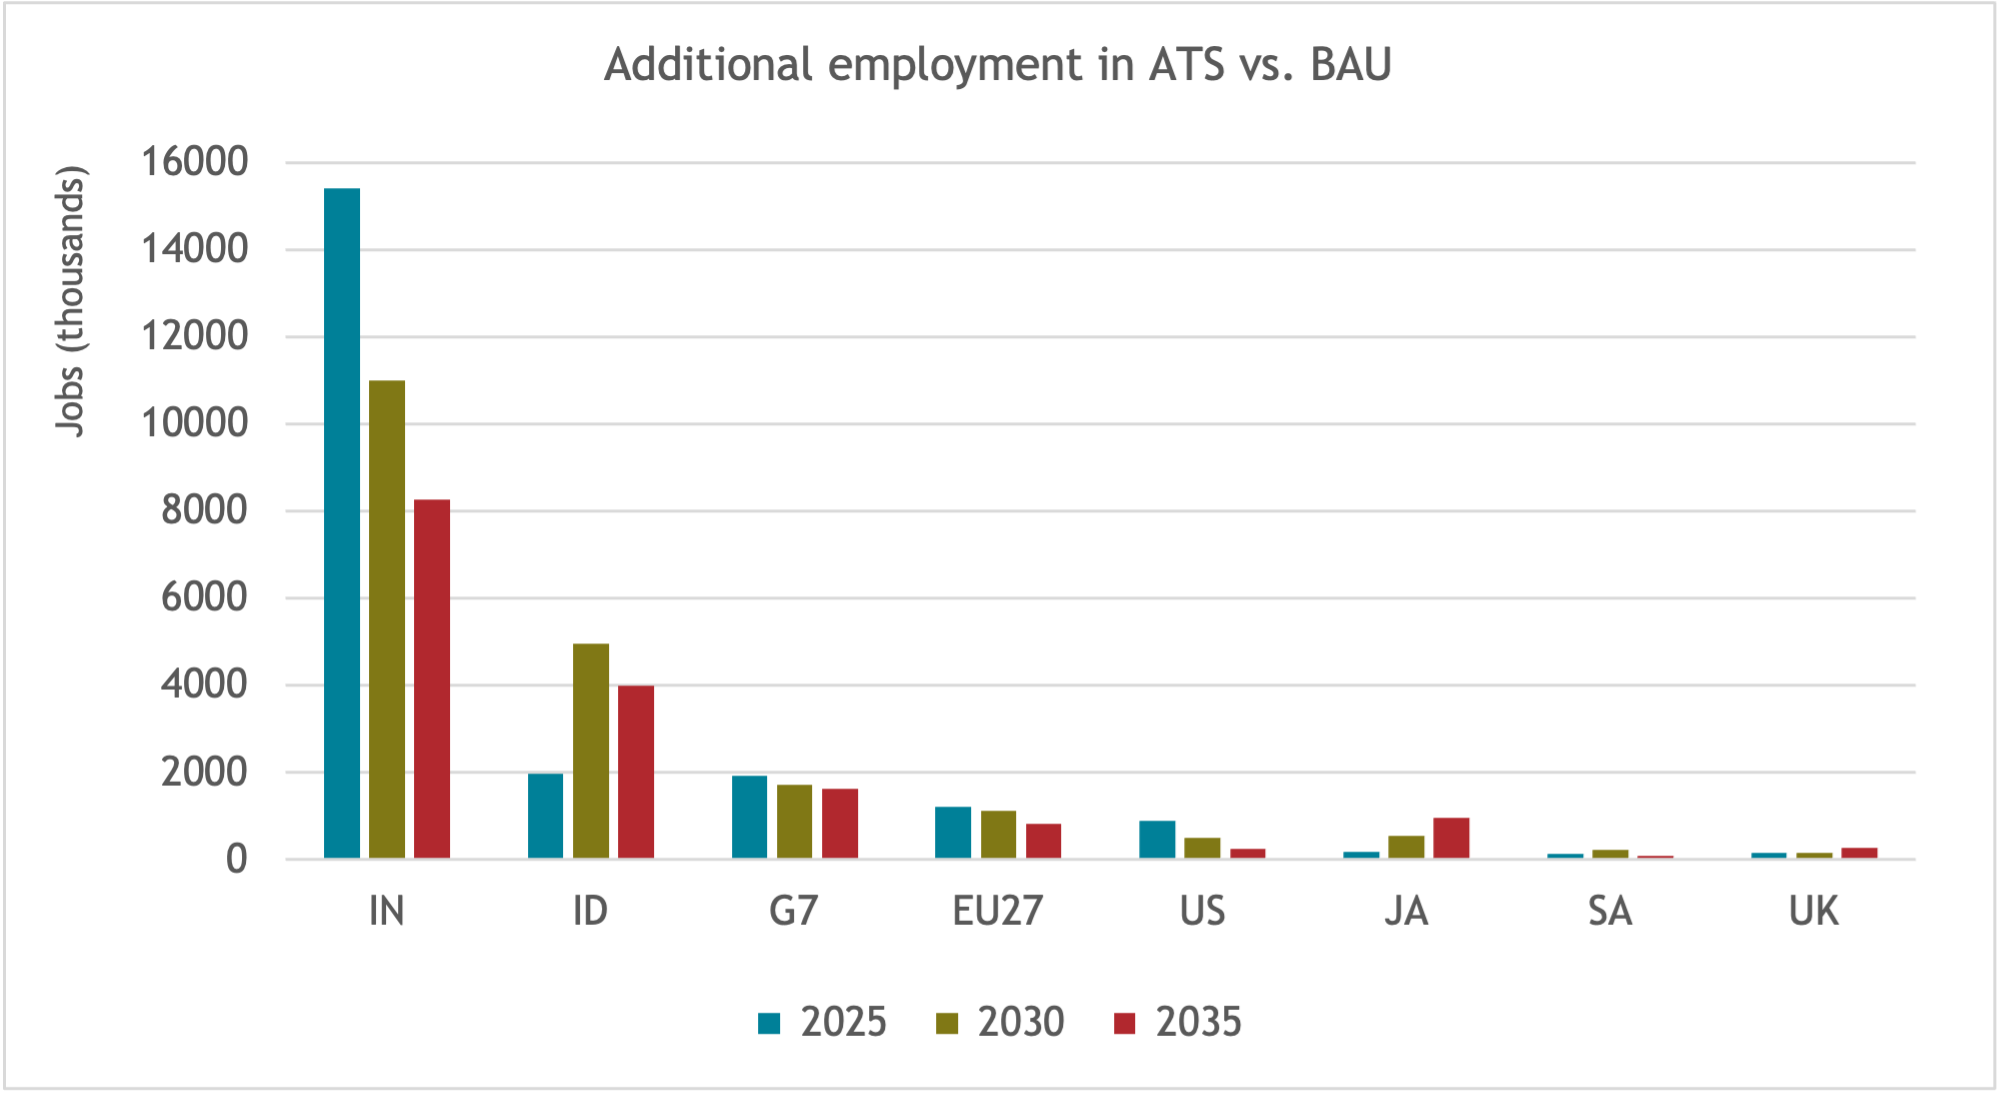
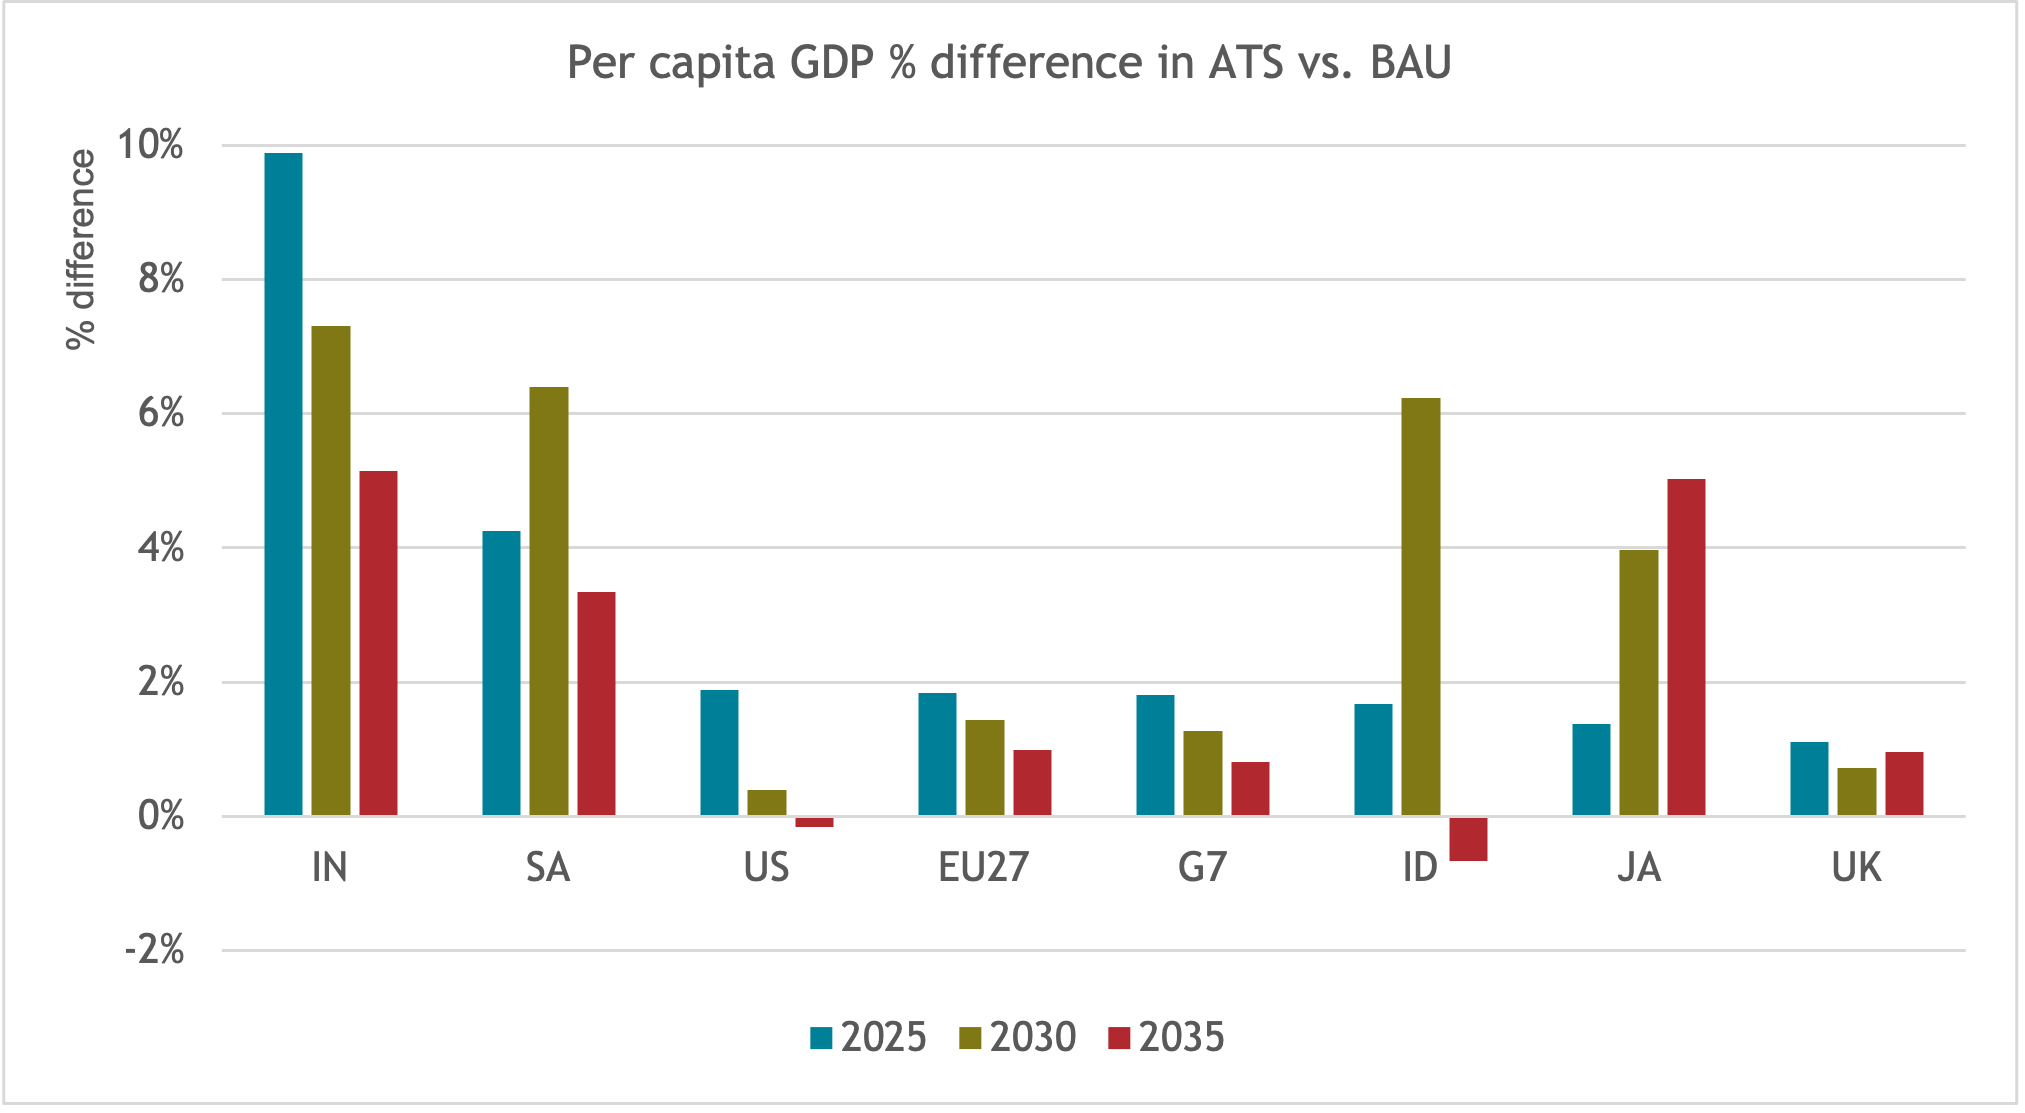
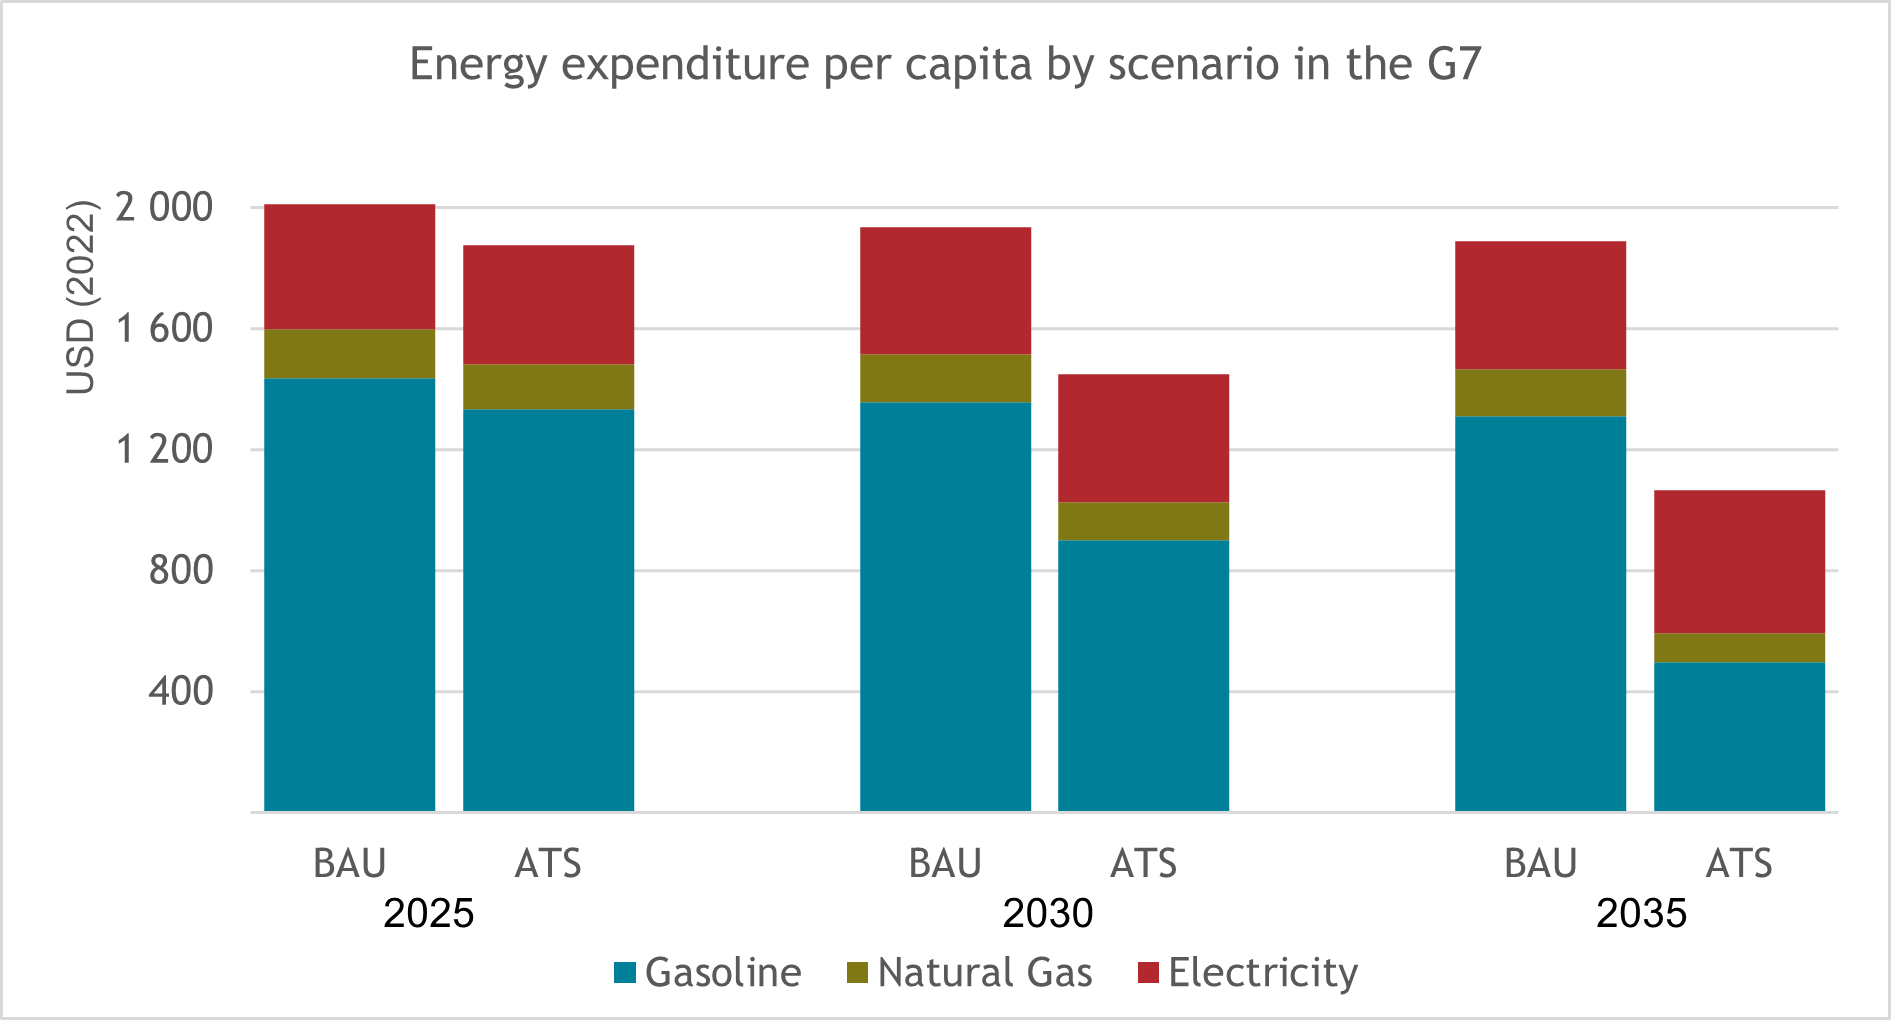
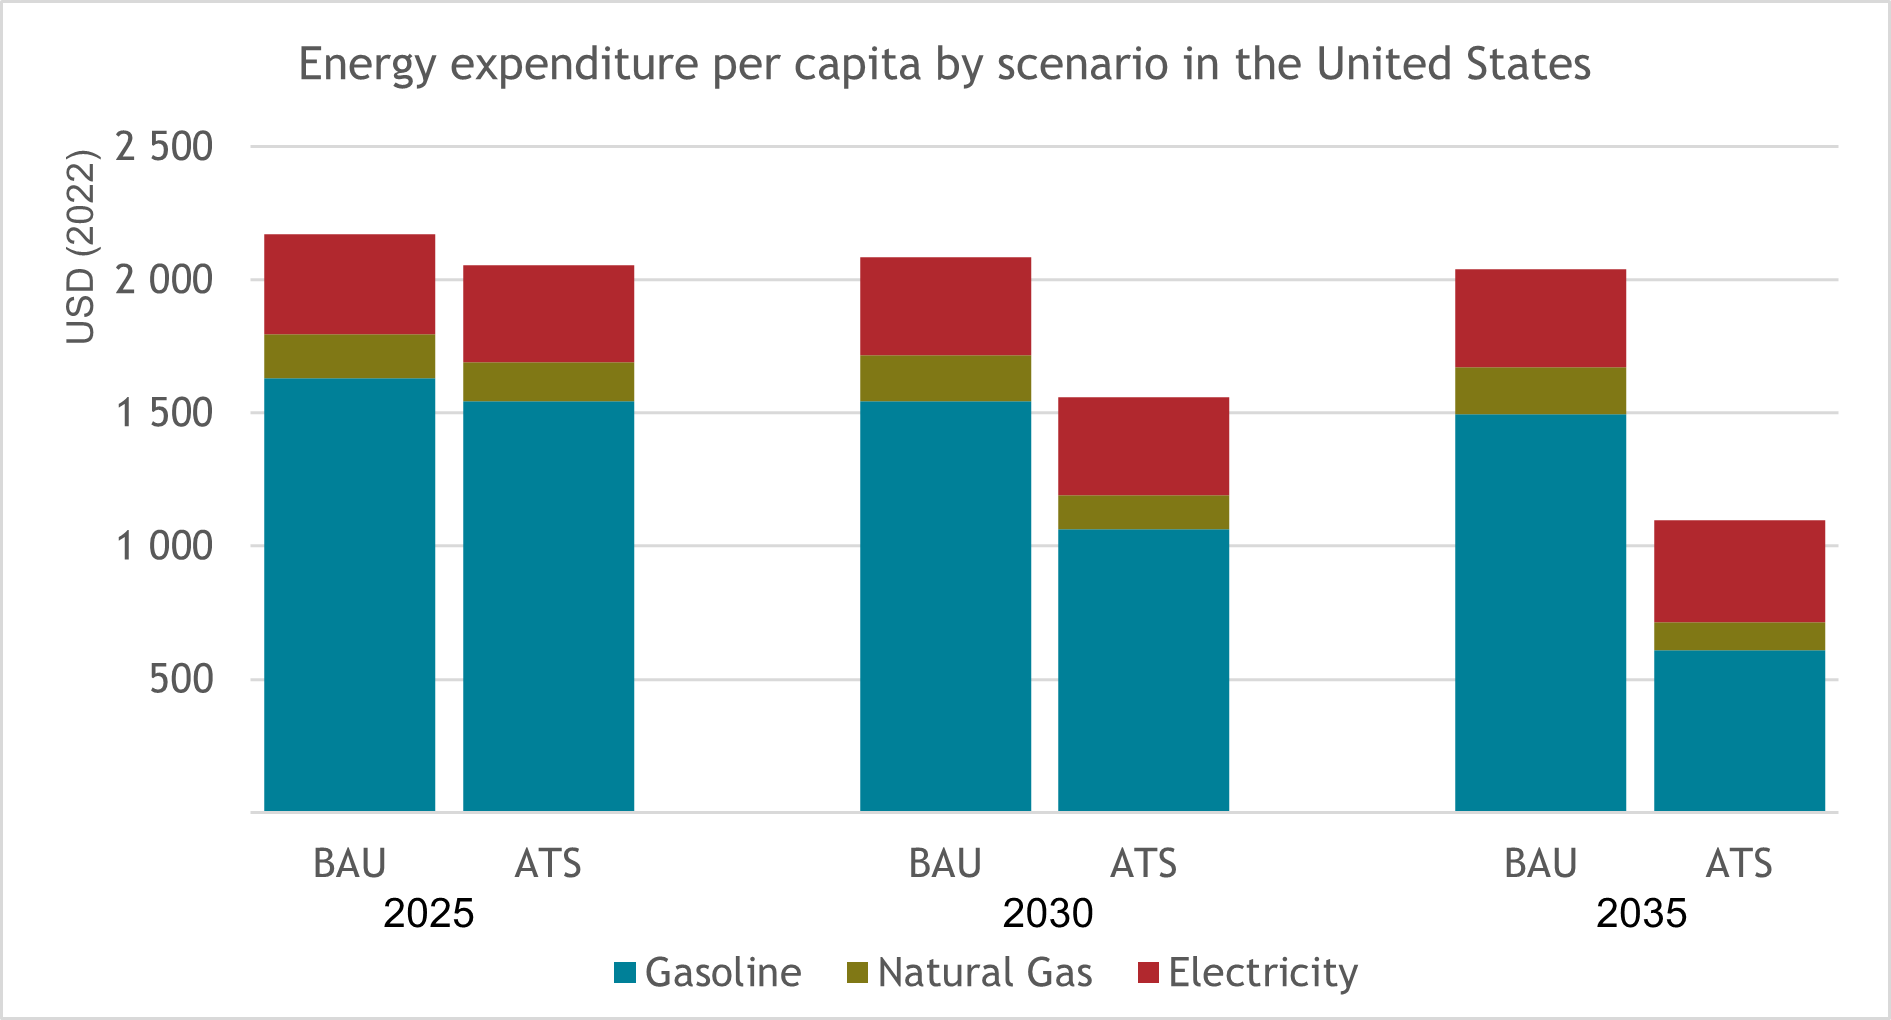
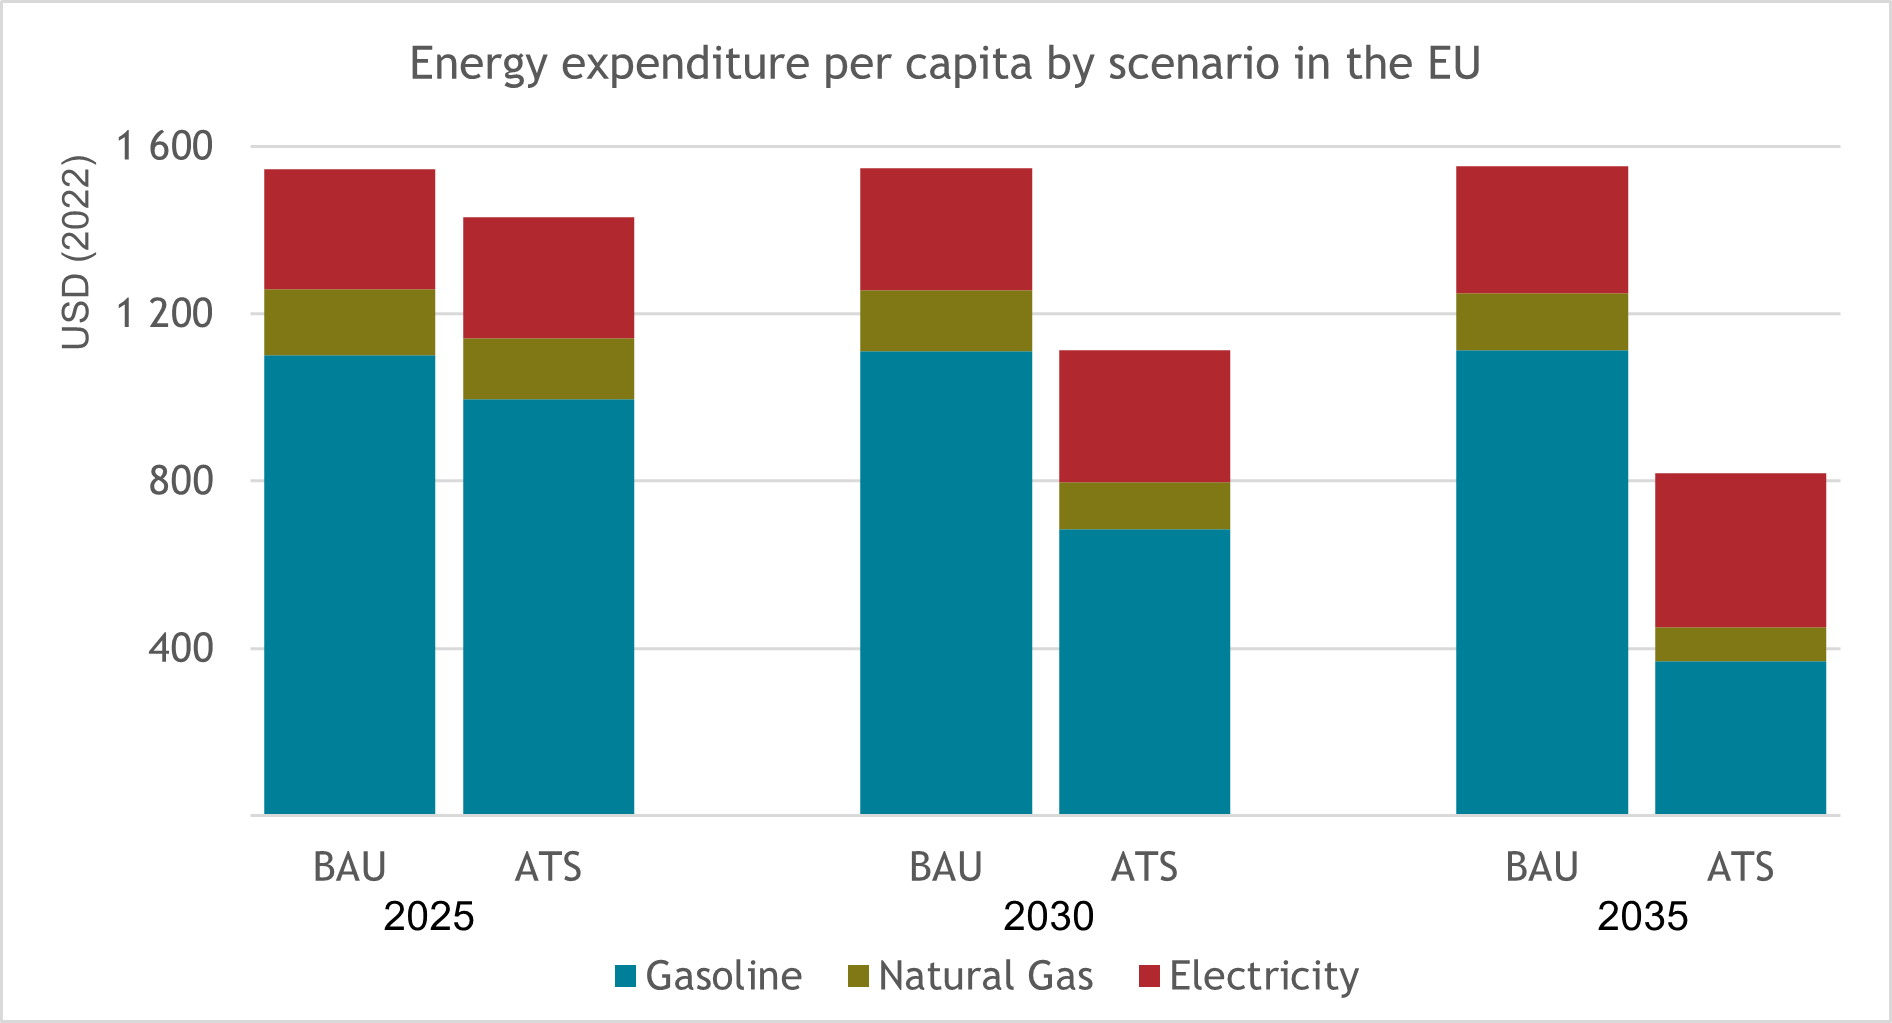
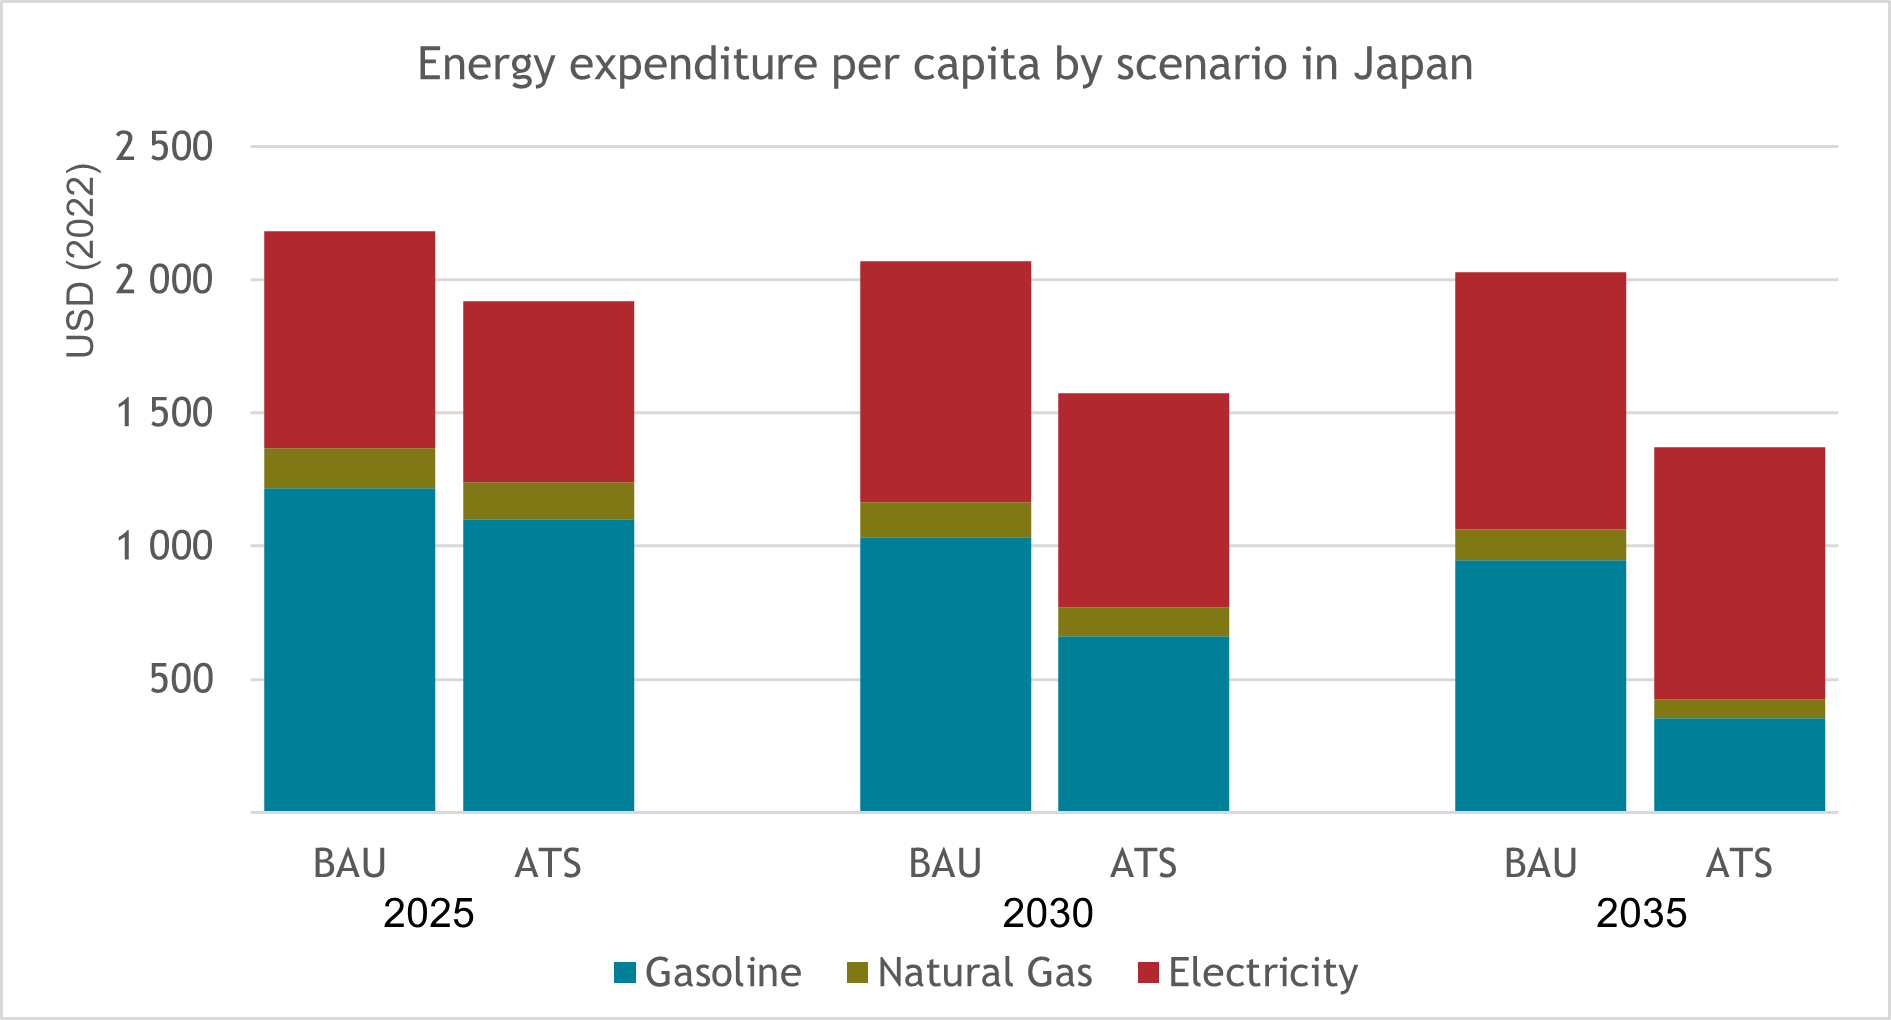
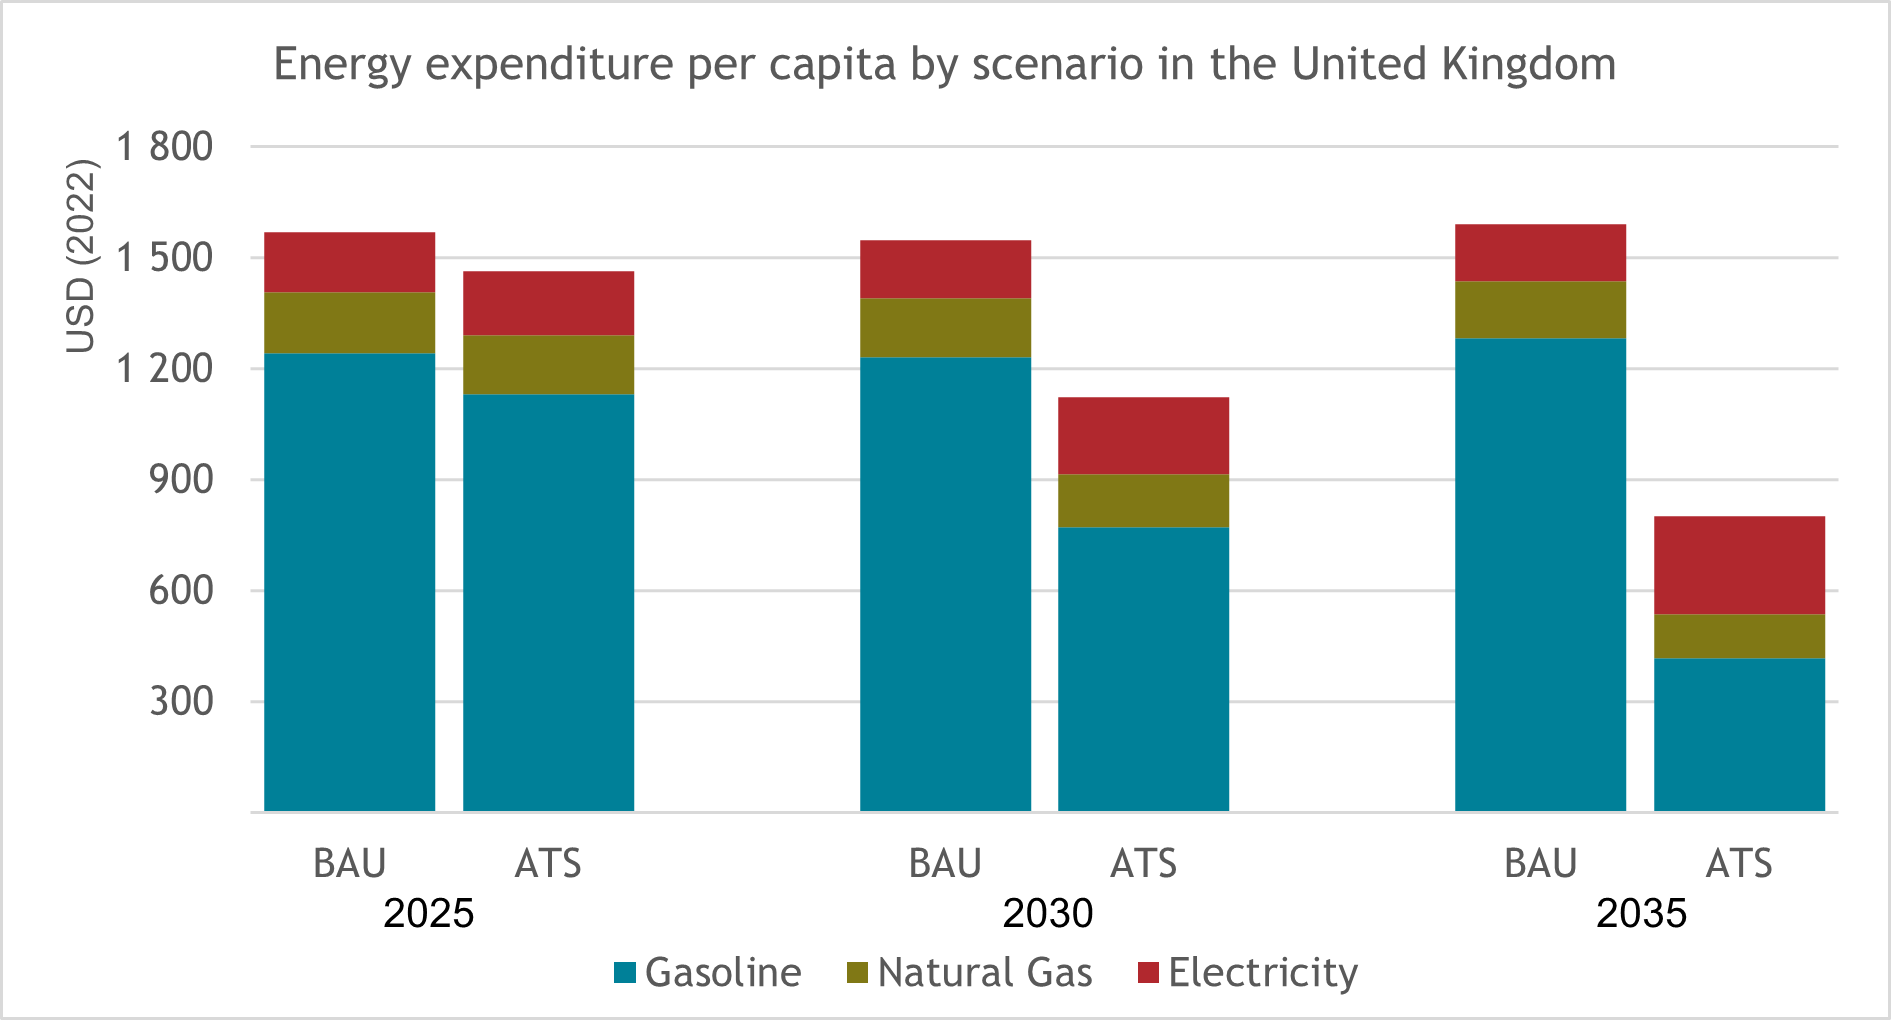
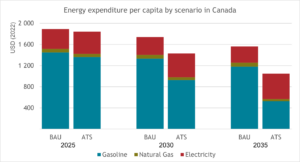
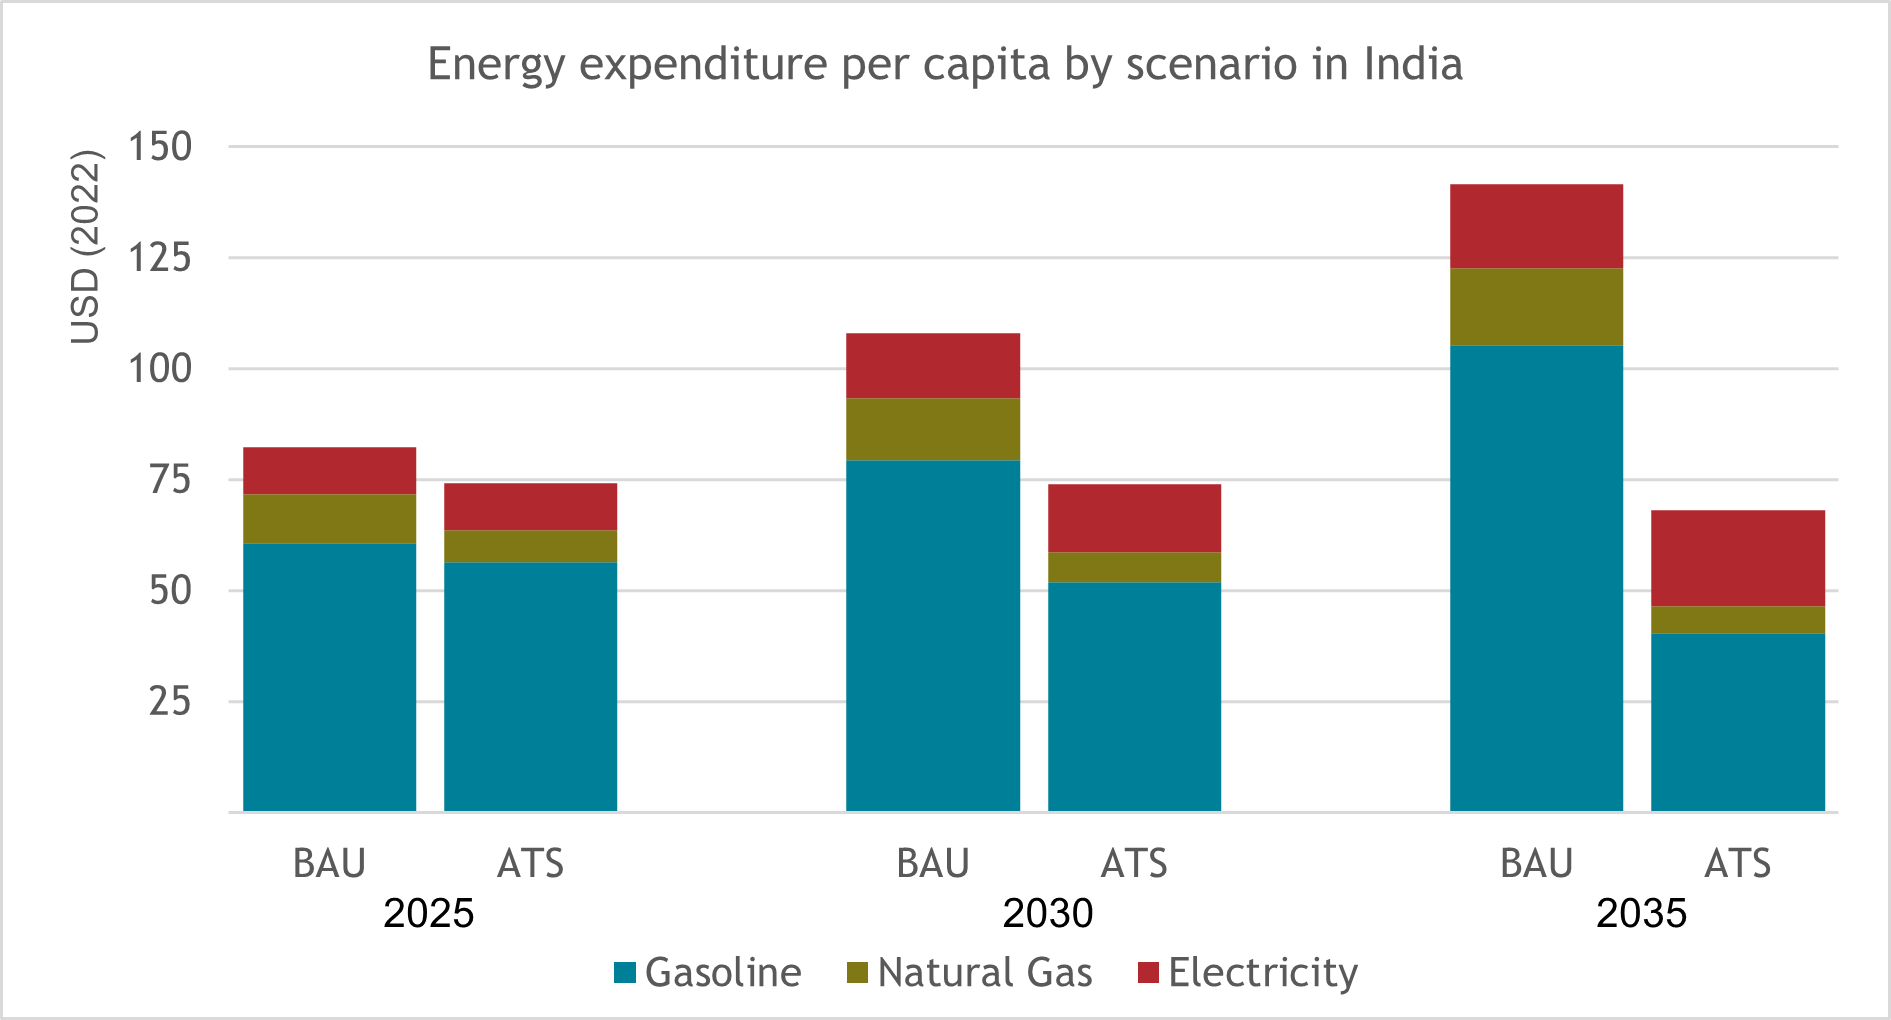
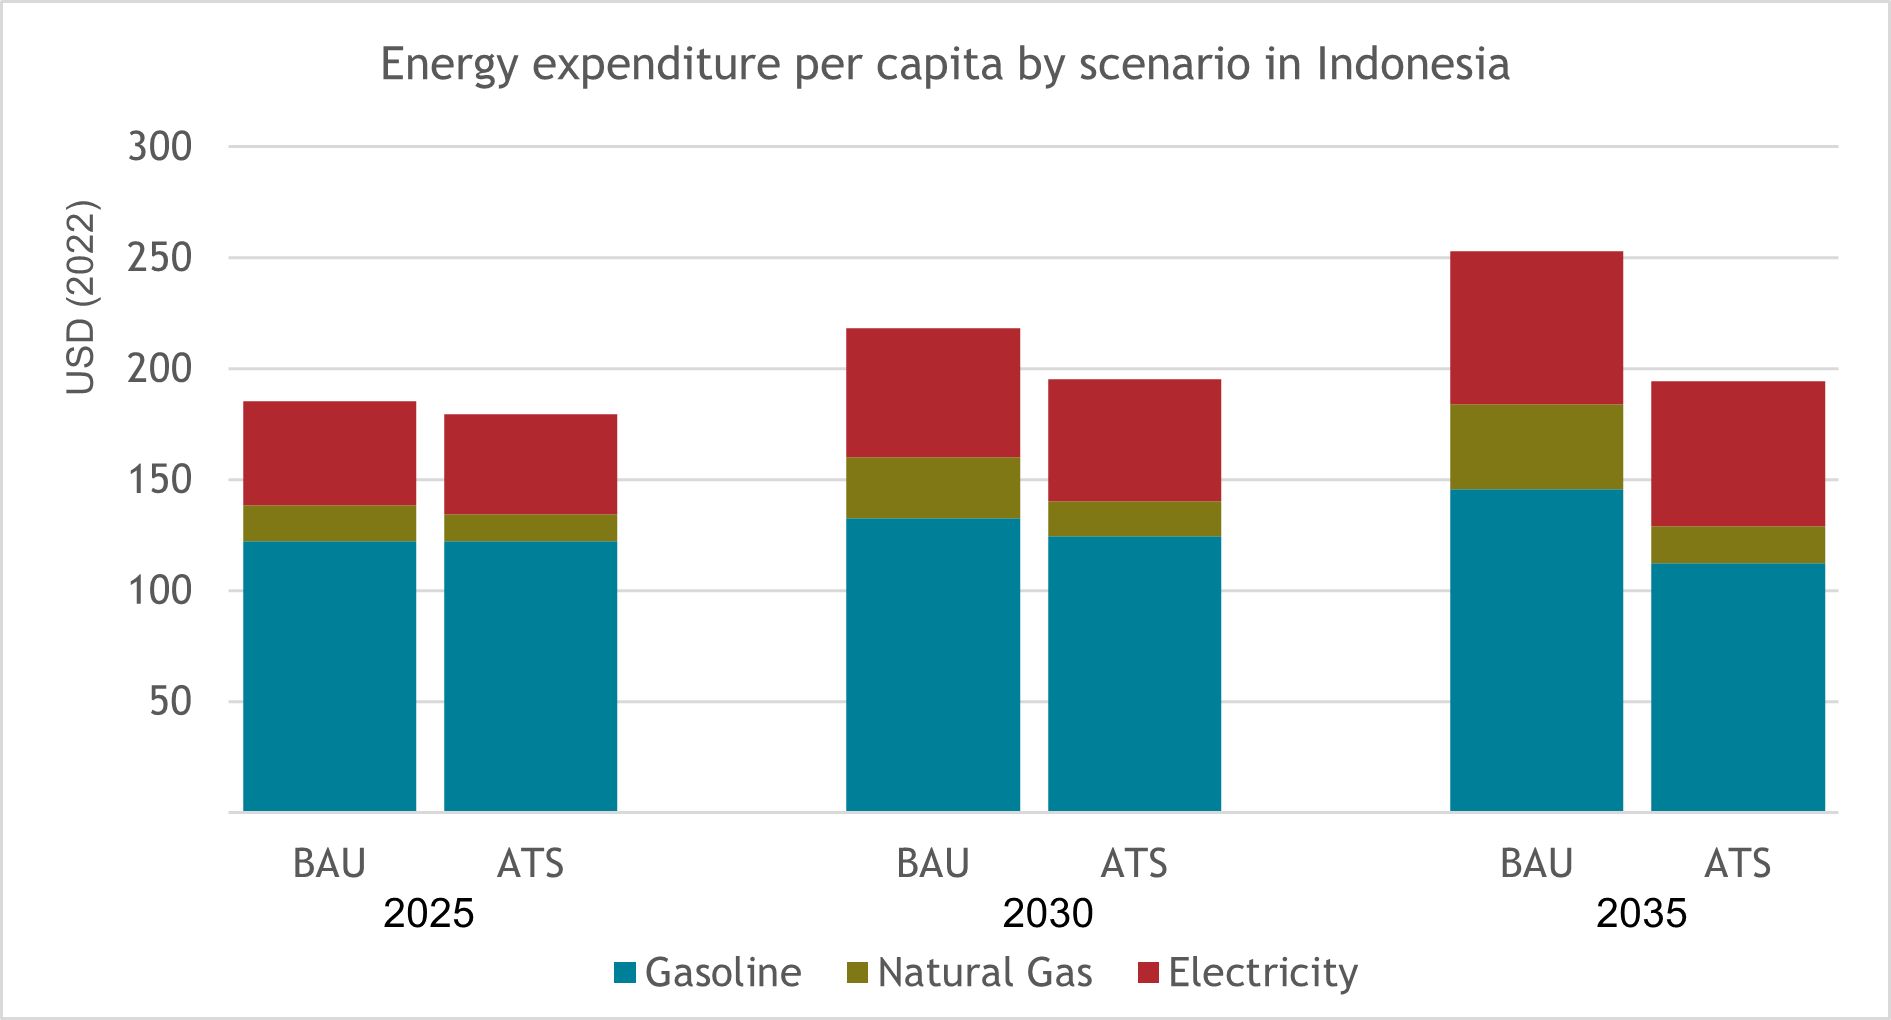
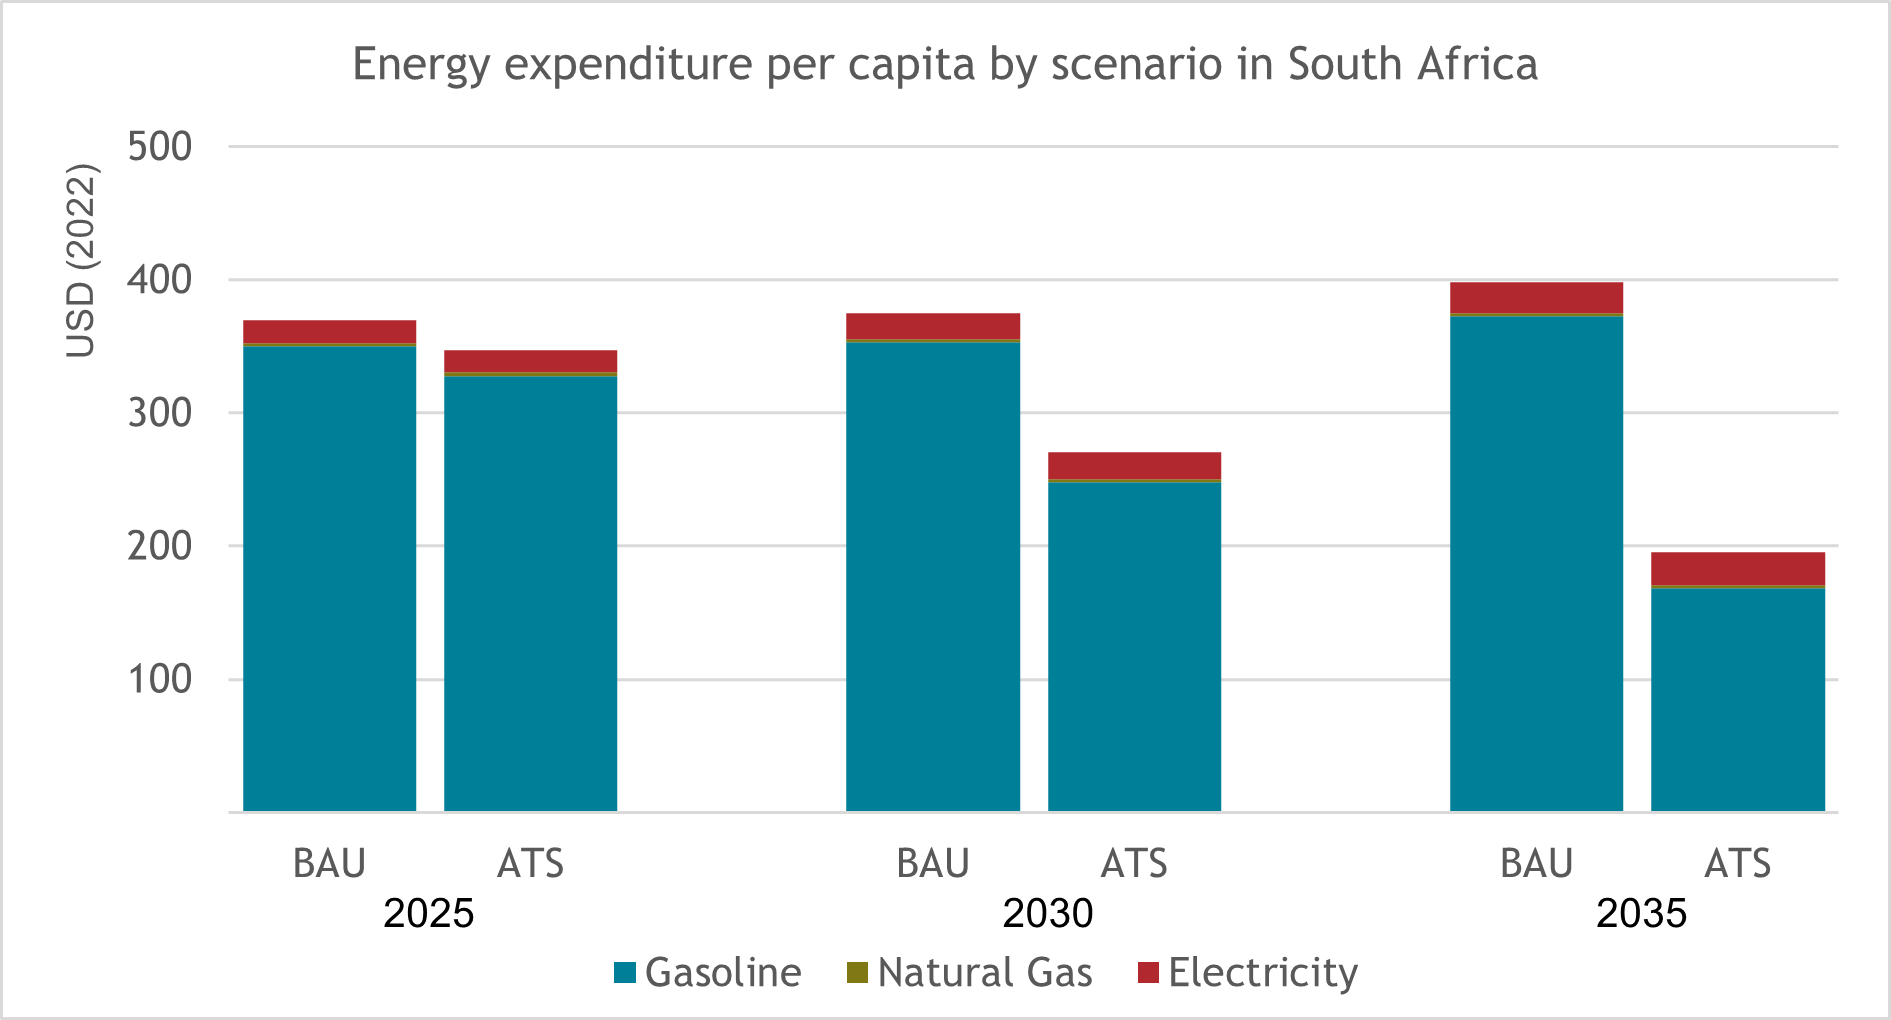
Our new socio-economic analysis and modelling, commissioned from Cambridge Econometrics, shows that the clean energy transition is affordable and in our economic best interest.  The research finds that government policies that accelerate the cleaner energy transition to net zero will reduce future energy bills and create jobs while maintaining GDP growth in both advanced and developing economies.

Policies backed by forward-looking businesses

Over 1,000 companies headquartered in nearly 60 countries, have joined calls for governments to set policies that accelerate the transition to clean energy and keep 1.5ºC within reach. They have put their name on public statements to the G20, European Union, United States, Japan, and United Kingdom.   

Businesses are calling for governments to deliver specific policies that will help accelerate the transition of the global economy to net zero emissions mid-century.

The We Mean Business Coalition commissioned Cambridge Econometrics to model a business-as-usual scenario vs an accelerated transition scenario where governments have delivered policies to accelerate the transition away from fossil fuels to net-zero. 

Key findings

Accelerating the clean energy transition to net zero will provide huge economic opportunities while protecting future generations from the worst impacts of climate change. Below are the key findings from this research and a set of modelled results that quantify the impact of accelerating the clean energy transition in key geographies (more on the background and methodology).   

One of the clearest findings is how reasonable and manageable an accelerated transition is for the economies modelled. These economies and societies will not only benefit from lower energy bills, more jobs and increased economic growth, they will also have avoided some of the worst impacts of climate change. This means countries will further benefit from reduced spending on healthcare and lower insurance premiums against climate-related disasters. 

Energy bills

The Clean Energy Transition will cut household energy bills

In every geography modelled, accelerating the clean energy transition will reduce household expenditure on total energy costs (which includes electricity, natural gas and gasoline) compared to business-as-usual policies in 2025, 2030 and 2035.   

This reflects the electrification of the economy, with homes being heated and cooled by heat pumps and drivers switching to electric vehicles (EVs). This represents a significant reduction in energy spending across the economy. The shift to renewable technologies allows for cheap energy, whose price is decoupled from geopolitical events that can trigger fossil fuel supply issues and consequent price hikes. With warmer homes and cheaper transport, lower income households experience a significant and positive disposable income shock, with less money being spent on heating and travel to work. 

Energy expenditure per capita by scenario in the G7

Figure 1: Energy expenditure per capita by scenario in the G7. Note: BAU= business-as-usual scenario; ATS=accelerated transition scenario.

To highlight a few key findings in Figure 1, if G7 countries accelerate the energy transition to a net zero economy, as modelled, the total energy bill per capita (electricity, natural gas and gasoline combined) will be on average $135 lower in 2025 than in the business-as-usual scenario at the same point in time. Beyond just the short-term, the analysis underscores the lifetime benefits that an accelerated transition scenario will have for consumers’ finances. The savings to families on their energy bill costs continues to increase year on year in the accelerated transition scenario. By 2030 the total energy bill per capita will be, on average, 25% ($488) lower relative to the business-as-usual scenario and by 2035 the average resident of a G7 country will be spending almost 45% ($825) less each year on their energy.  

Reduced per capita energy expenditure and percentage reduction

TABLE 1: Reduced per capita energy expenditure & percentage reduction (compared to business-as-usual scenario):

To highlight a few key findings in Table 1 – if the USA were to accelerate the clean energy transition, the modelling shows that by 2025 this would cut $115 from yearly per capita energy bills, a 5% reduction compared to the business-as-usual scenario.  In 2030 per capita energy bills will be cut by $529, a 25% reduction. By 2035 per capita bills will have fallen $940, down 46% compared to the business-as-usual scenario. The biggest cause of the saving is from a substantial reduction in gasoline consumption as people move to EVs. 

These strong findings are also reflected in the EU where the total energy bill per capita will be €108 ($114) lower in 2025 than in the business-as-usual scenario. By 2030 these savings increase as the total energy bill per capita is 28% or €412 ($434) lower relative to the business-as-usual scenario and by 2035 consumers will spend 705 ($743) or roughly half as much on their energy costs. These findings are mirrored in other advanced economies that are net energy exporters like the UK and Japan as they electrify their economies and reduce their emissions to net zero. 


Employment

The clean energy transition is good for jobs

Additional employment in ATS vs BAU

Figure 2: Additional employment in the accelerated transition scenario vs. the business-as-usual scenario in a given year. Notes: BAU= business-as-usual scenario; ATS= accelerated transition scenario. IN=India; JA=Japan; SA=South Africa; ID=Indonesia.

Policies that accelerate the clean energy transition will create more jobs than business-as-usual policies in 2025, 2030 and to 2035, as outlined in Figure 2 above. Given the diversity and disparity of the economies modelled and their carbon intensities, it is striking how consistent the job generation is for each time period.

For example, if G7 economies accelerate the clean energy transition to net zero, the modelling shows that more jobs will be created every year out to 2035, compared to the business-as-usual scenario. At its peak, the accelerated transition scenario will deliver over 1.92 million additional jobs in 2025. It must be noted that the transition has dynamic impacts on economies and job markets in the G7. Education and retraining policies will need to be put in place to manage workers through the transition as fossil fuel sectors decline and renewable energy, energy efficiency and EV sectors grow.

Developing economies with large populations will see significant job creation from the accelerated transition scenario over the business-as-usual scenario. In India, 15.4 million additional jobs will be created in the economy in the accelerated transition scenario, compared to the business-as-usual scenario. Similarly in Indonesia where nearly 5 million additional jobs will be created in the economy from the clean energy transition by 2030.

GDP

The Clean Energy Transition is good for economic growth

Per capita GDP % difference ATS vs BAU

Figure 3: Per capita GDP % difference in the accelerated transition scenario vs. the business-as-usual scenario in a given year. IN=India; JA=Japan; SA=South Africa; ID=Indonesia

Accelerating the clean energy transition will deliver economic growth for most of the geographies modelled in 2025, 2030 and 2035. Given the scale of the change needed in the economy to deliver net zero, it is striking how consistent and positive the economic growth is for each period modelled.

For the economies in the G7, the accelerated transition scenario will deliver higher levels of GDP than the business-as-usual scenario: GDP will be 1.8%, 1.3% and 0.8% higher in 2025, 2030 and 2035 respectively, underscoring that an accelerated transition is better for economic growth, especially in the near-term. It must be noted that the transition is not consistent for all economies in the G7, with those that are net energy importers benefiting more than energy exporters over time.

For example, an accelerated transition in the European Union will consistently create more economic growth than the business-as-usual scenario. As a major importer of fossil fuels and a leader in green technologies, the EU will see its GDP increase by a cumulative €7.3 trillion over the period 2022-2036 (discounted)2. For context, this is equivalent to 50% of the EU’s GDP in 2021. This shows cheap renewable energy combined with investment in energy efficiency will greatly improve the lives of Europeans.

This positive story of economic growth is also seen in Japan: GDP will be 1.4% higher in 2025 in the accelerated transition scenario than the business-as-usual scenario, 4% higher in 2030 and 5% higher in 2035. As a country with few natural energy resources and as a centre of advanced manufacturing, Japan stands to gain economically from the clean energy transition.

Looking to developing economies, they will also perform better in the accelerated transition scenario compared to the business-as-usual scenario. For example, the analysis shows that decarbonising India’s economy will not only reduce household energy costs and improve health outcomes, but it will also increase economic output and employment. India´s GDP in the accelerated transition scenario will be significantly higher than the business-as-usual scenario: 9.9%, 7.3%, and 5.1% higher in 2025, 2030, and 2035 respectively.

Country snapshots

The clean energy transition will be experienced differently by different countries, depending on their unique characteristics. Developing countries will have very different needs to developed countries, along with radically different demographic profiles.  

Each country’s energy profile, and thus emissions intensity, will also be at a different starting point. Their energy needs will also vary. For example, countries with harsh, cold winters will require significant heating capacity while those in warmer climates may have greater need for cooling technologies. The transition will also require different policy mechanisms depending on whether a country is a fossil fuel importer or exporter, due to the effect that the phasing out of fossil fuels will have on the labour market and the economy. 

Report background and methodology

The modelling in this paper is conducted using Cambridge Econometrics’ proprietary E3ME model, which compares an accelerated clean energy transition to net zero scenario to a business-as-usual baseline scenario. The economic implications of the policies contained within a given scenario are determined as the differences in outcomes between the scenario and the baseline, which each represent alternative versions of the future. This allows for an internally consistent comparison between the two. 

The Summary for Policymakers builds off the Cambridge Econometrics report.   

The final report with the modelled figures includes: 

  • A contextual discussion of the clean energy transition, how it affects the economy, the trade-offs it presents, where additional supporting policy may be required, and exploring the wider benefits of delivering net zero emissions by mid-century.  
  • A detailed examination of global evidence covering energy bills, jobs, and GDP growth, with a particular focus on a selection of the world’s major economies including the US, Germany, the UK, and the EU as a whole.  
  • The approach taken in a fresh analysis of the economic effects of accelerating the clean energy transition.  
  • The results of this modelling exercise on a country-by-country basis. 

Download the summary for policymakers

Download the full report and modelling

For further information on this document, the report and the comparative analysis please contact: Dominic Gogol – Deputy Policy Director – [email protected]

Back to top